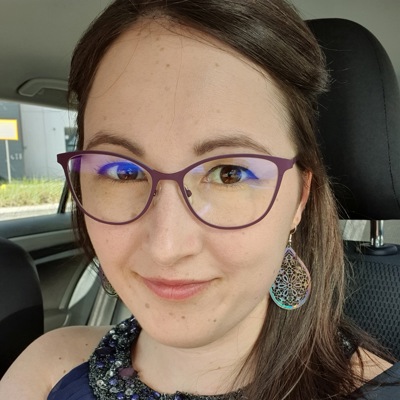
Eeva-Jonna, or Eevis, is an accessibility specialist and senior Android developer. She is also IAAP Certified Professional in Web Accessibility and Women Techmakers Ambassador. Her passion is to share knowledge, and she speaks and writes a blog. When she is not doing that, she explores the beautiful Finnish nature either by foot or kayak.
Eeva-Jonna Panula
Making Data Visualizations More Accessible – Lessons Learned
Graphs are a great way to visualize different types of data. But not everyone can consume them the same way - and if you add, e.g., touch interactions, not everyone can use the pointer the same way. Also, not everyone understands graphs the same way - due to prior familiarity, disability, or other reasons. And what if you can't see at all? That is another factor that adds complexity to data visualizations.
In this talk, I will share some tips and demonstrate how you can improve the accessibility of your graphs so that they work for different types of users - whether they are using assistive technologies or not. You'll get actionable advice to take to your apps and improve their accessibility immediately. You will learn about adding text alternatives for data visualization, adding alternatives for touch, and assuring that color is not the only way to communicate information.

